Minimize Process Variance by Optimizing Velocity Stability
By Seth Tolkamp, Test Engineering
Published on Aug. 23, 2023
Introduction
This article will help give users a deeper understanding of direct drive velocity performance. By understanding the sources of velocity error in a direct drive (linear motor) stage, you can learn how to optimize the speed, servo tuning, and loading. This allows you to improve performance for a variety of applications, such as greater consistency in material deposition applications and sharper, undistorted captures in scanning applications. It is a follow-up to our Intro to Velocity Stability and Following Error article.
Key take-aways
- Keeping the speed below 5 mm/s will offer the best consistency
- Setting servo tuning to “stiff” in Zaber Launcher makes the feedback more responsive
- Ensuring payload mass is 2-3x the carriage's mass will minimize frictional deviation but increase following error
See figure 1 below for a demonstration of the improvement from some of these changes.
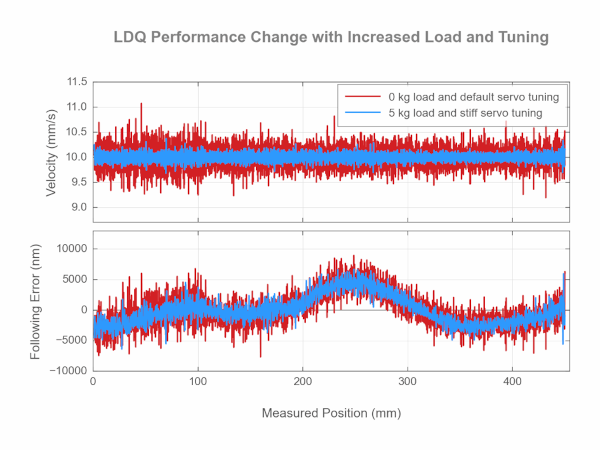
Figure 1: Example of a significant motion smoothness improvement from adding load and stiff servo tuning to an LDQ.
Lowering Speed
On most direct drive devices, velocity stability and following error degrade as speed increases. Intuitively this makes sense: as speed increases, the controller has less time to correct for changes in bearing drag or the motor’s force constant.
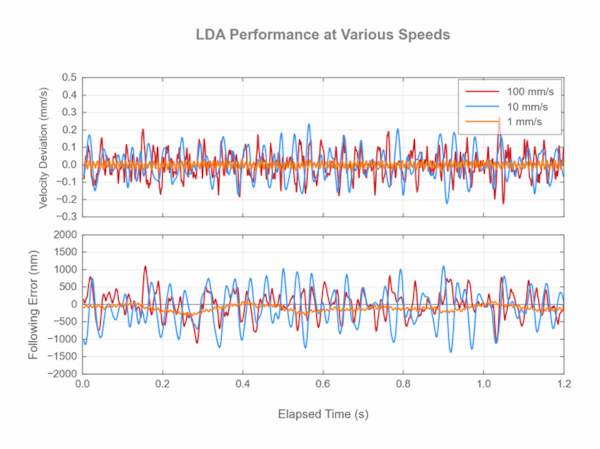
The sensitivity is greatest at low speeds. As a rule of thumb, when increasing the speed from 1 mm/s to 10 mm/s the absolute velocity error increases by about 10 times and the following error roughly triples. In contrast, when changing from 10 mm/s to 100 mm/s the velocity and following errors either remain similar or possibly double, depending on the device. The LDA in Figure 2 below demonstrates the dramatic change in stability and following error increasing between 1 mm/s and 10 mm/s, but only a marginal change between 10 mm/s and 100 mm/s.
Error Sources at 1 mm/s
When the stage is moving slowly at speeds less than 5 mm/s, the following error resembles the positional accuracy of the stage. This is because the frequency of friction changes is low enough that the feedback loop corrects for them quickly, and the stage’s inertia is minimal compared to motor thrust. This intuitive result is evident below in figure 3, which compares the following error result from a 1 mm/s move (in orange) and the accuracy test result when stopping at each point to measure error (in blue) on the same device.
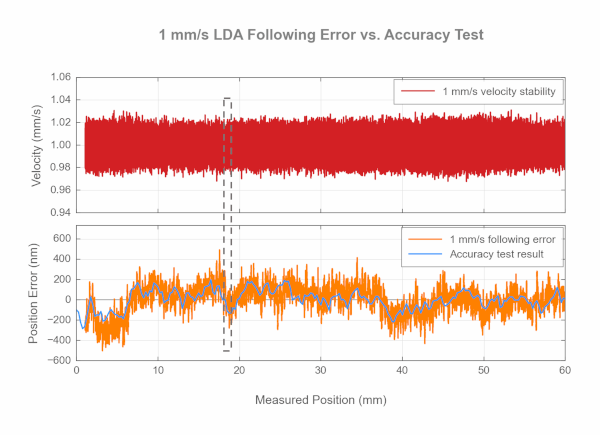
Figure 3: 1 mm/s LDA move compared to accuracy. Highlighted section shows the region inspected in figure 4.
Interestingly, zooming in on the apparent random noise in the above plot we see a well resolved sine wave from subdivisional error caused by encoder alignment and electrical imperfections.
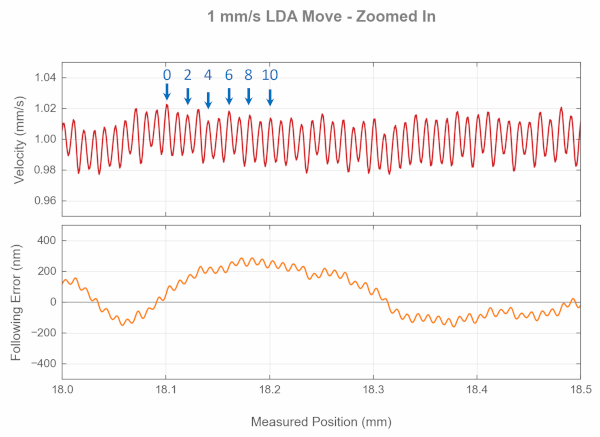
The wave peaks 10 times in 0.1 mm (0.1 s in our 1 mm/s move) which indicates a period of 0.01 s. Taking the FFT of the measured velocity reveals the expected dominant signal at 100 Hz in figure 5. The encoder on the LDA has a 20 µm pitch (which is interpolated down to 1 nm by the controller). When traveling at 1 mm/s, slits in the encoder grating pass by the photodetector at 50 Hz as seen below in equation 1.
| (1) |
This 50 Hz signal is not dominant, but gives rise to the 100 Hz signal due to the alignment of the photodetector to the encoder grating on this specific LDA. This alignment error is causing a twice per encoder electrical cycle subdivisional error.
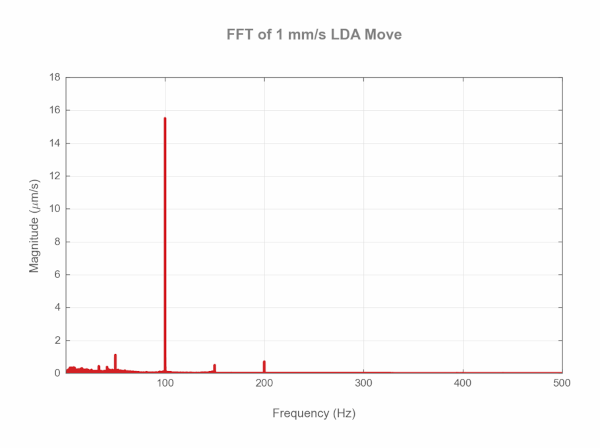
At 1 mm/s, all linear direct drive devices will have similar FFTs to this, but with the dominant frequency shifting between 50, 100, and 200 Hz depending on the specific stage's encoder alignment and imperfections.
Error Sources at 10 mm/s
At 10 mm/s, errors in the 5 - 80 Hz range dominate. These are caused by changes in bearing drag, which can change too quickly at this speed for the feedback loop to respond to. The same error with a twice per encoder grating signal appears again but is now shifted to 1000 Hz; though it may look significant, in reality it only adds a small bit of noise around the blue 10 mm/s line of figure 2. Except for the most demanding of applications, it would be fine to sample slow enough as to filter this signal out (as we have done).
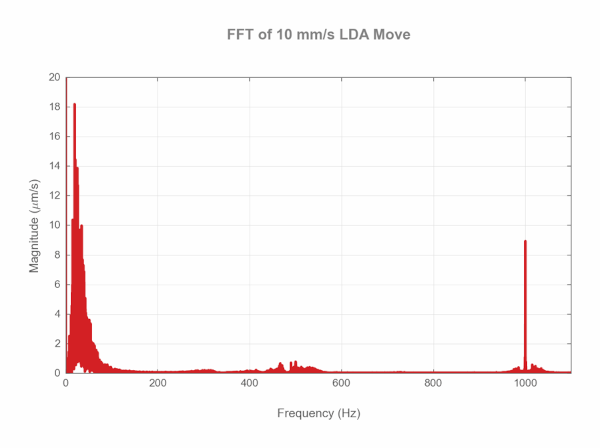
This is similar to FFTs of other direct drive stages at this velocity, though the magnitude of frequency spikes at 500 and 1000 Hz caused by the encoder is often less than those seen on this stage. The exact pattern of errors in the 5 - 80 Hz range is device (bearing) dependent, though on a macro scale it's always similar to what is pictured here.
Error Sources at 100 mm/s
When moving at 100 mm/s encoder errors are insignificant and the dominant errors are caused by a combination of the bearing effects and thrust variation of the linear motor. Thrust variations are caused by the magnetic and electrical pitch of the direct drive motors. On Zaber’s LDM and LDQ stages N-S magnet pairs are spaced 30 mm and on the LDA and ADR magnets are spaced 15 mm. On the LDM at 100 mm/s this gives an expected frequency of 3.33 Hz according to equation 1. On this LDM, most spikes from 5 - 80 Hz are multiples, or harmonics, of the 3.33 Hz magnet pitch signal.
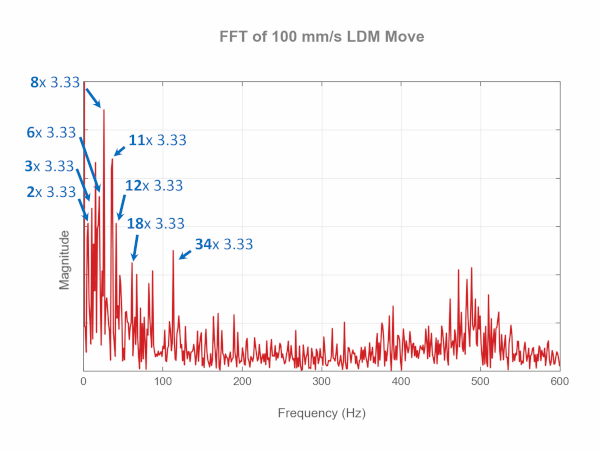
Figure 7: At these higher speeds on the LDM the only identifiable frequency is that of the magnet pitch at multiples of 3.33 Hz.
This is typical of stages other than the LDQ. The LDQ uses recirculating bearings and while they are some of the best recirculating bearings on the market, with imperceptible vibration from recirculation by hand, the recirculation frequency can be picked up in velocity tests.
In the LDQ a new roller enters the loadpath every 6.4 mm on average. Again using equation 1 we find that at 100 mm/s this should give harmonics every 15.6 Hz, which is exactly what we see in Figure 8 below.
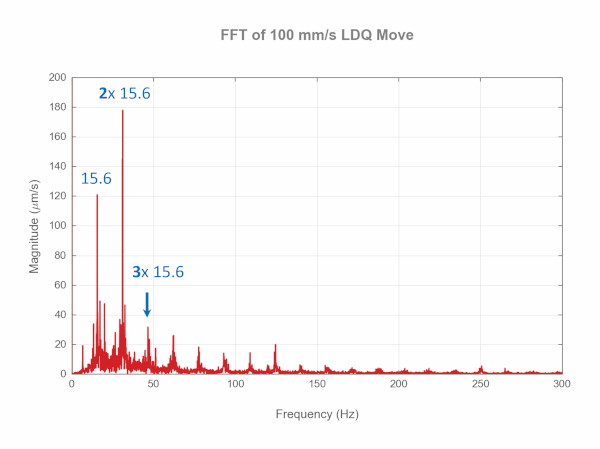
In general, motion smoothness errors can be decreased by 10x by reducing target speed from 10 to 1 mm/s. Different speeds cause different errors because the dominant error frequencies change and the controller has more or less time to correct for them. The dominant error transitions from subdivisional encoder error to bearing errors between 4 and 8 mm/s. By understanding these effects at different stage speeds one can choose appropriate sample frequencies when measuring performance, assess whether these error frequencies are expected to be problematic in a given application, and make a balanced decision when selecting system speeds.
Adjusting Servo Tuning
Servo Tuning affects the dynamic performance of direct drive stages, and as such has a large impact on velocity stability. Using the Servo Tuning app in our Zaber Launcher software allows custom tuning of a direct drive device’s feedback loop. To optimize velocity stability, use the Simple tab and bring the “stiffness” slider to “1” or “stiff” inside the app. Notice below that a stiff servo tuning reduces the following error by 50% and velocity error by 40% on this LDQ over smooth tuning.
Advanced users can explore the additional tabs in the Servo Tuner application where custom PID tunings and advanced control parameters can be modified to further stiffen the controller or increase the feedforward gain.

Optimizing Load
The Servo Tuner should also be used when changing device payload. In general, a higher payload leads to better velocity stability performance but worse following error. These effects occur because the larger mass, and therefore inertia, is less impacted by changes in bearing drag force or motor thrust. This same reasoning explains why following error is often worse with higher load, it takes longer for the controller to correct a lagging trajectory after detecting the error.
The LDQ shown below sees a 40% increase in velocity stability and an 8% degradation of following error when tested with a 5 kg payload vs a 0.38 kg payload. On the LDM and LDA going from a 0.38 kg to 1 kg payload improves velocity stability and degrades following error by about 10%.
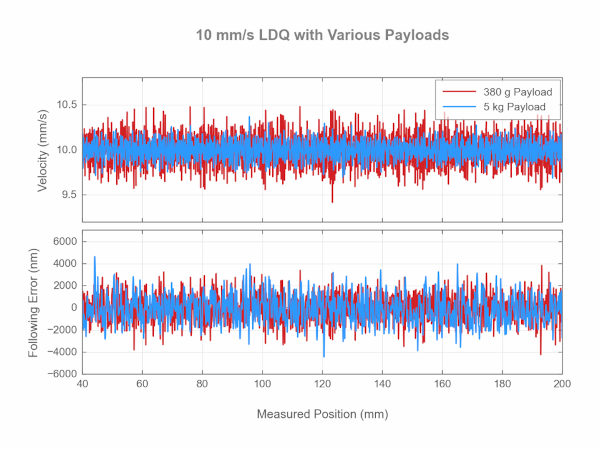
When looking to maximize performance users must consider whether their application benefits most from velocity stability, such as in a deposition application, or from low following errors, such as when laser etching or micro-machining. To increase velocity stability for deposition applications users should consider adding load equal to 2-3x the carriage’s mass centered over the stage top. Conversely, for applications that require low following errors such as laser etching or micro-machining, the end effector should be built to be as light as possible.
Conclusion
The magnitude and frequencies of velocity and following errors change greatly over the 1 - 100 mm/s range as the main error sources shift from the encoder, to bearings, to motor magnet spacing. Slow speeds have the best performance as position error approaches stage accuracy. To get the highest performance at any speed, servo tuning should be as stiff as possible without causing control loop instability or ringing and to maximize velocity smoothness stages should be loaded with at least enough weight to double the moving mass compared to only moving the carriage. Making these simple adjustments can easily cut velocity and following error in half.
