Velocity Stability and Following Error
By Seth Tolkamp, Test Engineering
Published on May 26, 2023
Introduction
In laser etching and deposition applications part inaccuracies and clumps of deposit can be caused by dynamic errors such as poor velocity stability and path following errors. Static specs like accuracy and repeatability are often the first that come to mind to users of motion control systems, but the dynamic performance, which can be thought of as "motion smoothness", can be much more important. Velocity stability is the dynamic specification most people have heard of, but it isn’t always the most meaningful specification to optimize.
This article explores velocity stability and following error specifications, discusses how Zaber specifies velocity performance, defines the sample frequency, payload, target speed, and servo tuning Zaber uses, and gives an overview of how a stage’s velocity performance can be analyzed in-situ using Zaber Launcher.
For a more in depth look at how velocity performance on direct drive devices can be optimized and how it is impacted by speed, payload, and servo tuning, as well as what the error sources are and at what frequencies they appear, see the next article in this series.
Velocity Stability vs. Following Error
The term velocity stability refers to the maximum deviation of device velocity over a move from the average velocity of the move. It is often referred to as velocity ripple, constant velocity, or speed stability.
Following error is a slightly more complicated but often better metric to describe trajectory smoothness. Following error is most easily understood as the stage’s position error over a move; it is a measurement of the distance between the actual device position at any given time and the expected device position given the average actual velocity of the move. It is calculated by subtracting a best fit line from the position data over the move. Following error is sometimes referred to as tracking error.
Figure 1 below shows a typical velocity stability and following error plot of an X-LDA traveling at 100 mm/s.
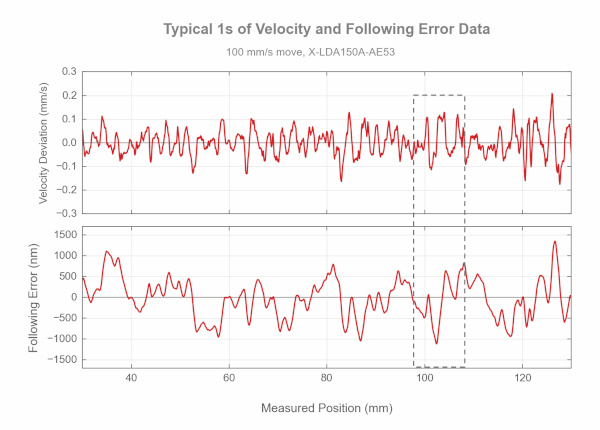
Following error is the integral of the velocity’s deviation from average over the move and as such does not directly capture information about how quickly the device vibrates or slows down and speeds up over a move, instead it measures how much the device leads or lags the trajectory.
In general, we favor following error over velocity stability as a metric for three reasons:
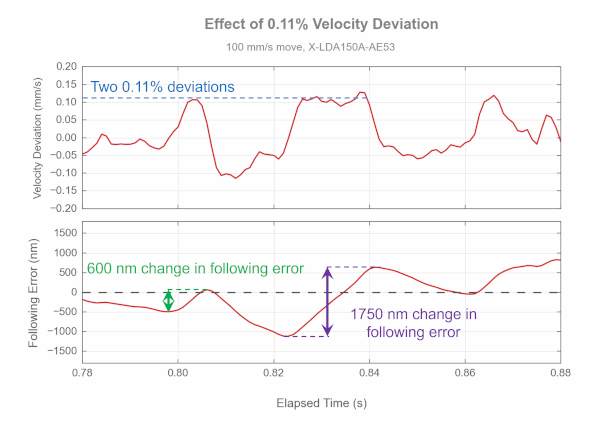
- It more clearly communicates stage motion: In many applications a velocity stability percentage specification does not fully communicate the aspects of motion that matter to a customer. Below is an example of two 0.11% velocity deviations of a 100 mm/s move that produce wildly different following errors. The first velocity deviation is brief and adds a 600 nm change in following error, while the second lasts approximately 3x longer and produces a 1750 nm change in following error. In a deposition application the second deviation would produce a “thin” section of deposition 3x longer than the first deviation. In a laser etching application the second deviation causes a shift in trajectory tracking much larger than the first, all while conforming to the same 0.11% velocity stability spec.
- Direct vs. Indirect Measurement: Another difference between velocity and position is how their values are determined, both with interferometers or in customer applications. Following error is calculated directly from positional data while velocity is not measured directly, instead it is the differentiation of two consecutive positional measurements. The simple fact that in most customer setups as well as in Zaber’s test lab the position is what is directly sensed is a good reason to favor, or at least consider, following error over velocity stability.
- Differentiation and Sample Frequency: The differentiation of position to calculate velocity means velocity measurements depend greatly on sample rate, and too high of a sample rate can overwhelmingly amplify insignificant perturbations in stage velocity as well as measurement noise. A simple way to think of this is demonstrated by the formula for velocity below. As t approaches 0, the value of the expression explodes, amplifying any noise in the measurement of x. Differentiation is well known to decrease signal-to-noise ratio and produce what is known as “blue” noise.
 |
(1) |
- Following error does not suffer from this phenomenon and instead (assuming reasonably quick sampling) is immune to increases in sample frequency.
Measurement Frequency
As alluded to above, sampling frequency can have a large impact on the results of velocity stability.
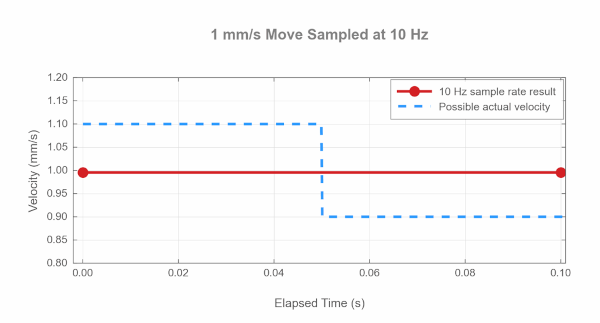
To simplify, consider the 0.1s move at 1 mm/s sampled at 10 Hz shown in Figure 3 below. This measurement simply reported the velocity of the move as the average velocity of the entire move, when the stage could have sped up by 0.1 mm/s for the 1st half and slowed by 0.1 mm/s for the 2nd half as sketched in blue.
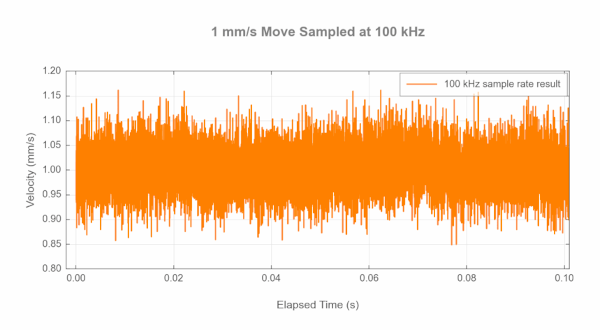
Conversely, sampling the same move at say 100 kHz will report the maximum velocity deviation of many 0.01 ms segments of the move with a velocity deviation of up to 0.15 mm/s as seen in Figure 4 below. These large deviations are caused by errors in the sensor’s position and time measurements as well as actual vibrations of the target and sensor. On a small enough timescale the atoms in any sample are always vibrating, but this vibration is not meaningful to measure.
Below is a typical 1 mm/s LDM move with the orange line showing that sampling at 100 Hz leaves the data fairly crude. This sample rate is well below the Nyquist frequency of the signal which has dominant components at 50 and 100 Hz (more on this in the next article). By contrast, a 1000 Hz sample rate gives good resolution of the signal without noise amplification while sampling at 10,000 Hz adds 0.02 mm/s of noise, a significant amount relative to the LDM’s performance at this speed. It is possible to smooth/filter the 10,000 Hz data, but doing so just produces the original 1000 Hz signal with no additional benefit.
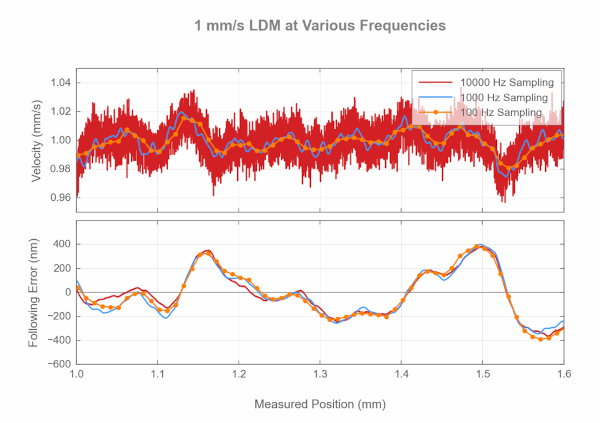
Figure 5: Velocity and following error with various measurement frequencies. Note that the following error is almost identical in each case!
It is important to choose a measurement frequency that is relevant to the application being considered. In general Zaber has found 2000 Hz to be the best frequency to specify velocity stability because it captures the meaningful movements of stages while minimizing noise amplification during differentiation. In the above plot of the LDM 1000 Hz works fine, but on some devices 2000 Hz captures more detail.
Zaber's Spec
At Zaber we have chosen to specify device performance under the following conditions:
- 100 mm/s move
- Reasonable device payload
- Stiff servo tuning
- 2000 Hz sample rate
100 mm/s is a common speed used by other motion control companies and as discussed in the Servo Tuning section of the next article the tuning can have a significant impact on velocity stability and following error.
| Device | Speed (mm/s) | Payload (g) |
|---|---|---|
| LDM | 100 | 1000 |
| LDA | 100 | 1000 |
| LDQ | 100 | 5000 |
| ADR | 100 | 550* |
| DMQ | 10** | 380* |
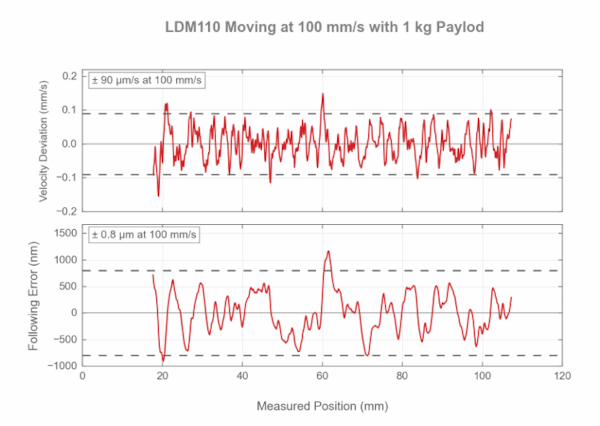
The variable nature of velocity stability and following error means that it is difficult to specify a single meaningful number that performance will always be within. Instead, Zaber reports velocity stability and following error as the number that the stage will be within 95% of the time. This value is calculated as the average velocity or following error plus double the standard deviation, as demonstrated in equation 2 below.
| (2) |
To further simplify, velocity stability is often represented as a percentage of the commanded velocity. The below performance plot of an LDM would be spec’d as having a velocity stability of ±0.09% at 100 mm/s with a 1 kg payload.
Characterizing Stage Performance with Zaber Launcher
Velocity stability and following error are impacted by many different factors and can vary greatly device to device or situation to situation. As with any dynamic measurement, stage performance will be notably better bolted to an optical table than placed on an unstable desk. For these reasons it can be useful to characterize how a device is performing in your own setup.
Using Zaber’s software Zaber Launcher, any stage with a direct reading encoder (-DE or -AE encoder options) can measure its own velocity stability and following error.
Stage Encoder vs. Interferometer Measurements
An interferometer is a laser-based measurement instrument that measures distance. A retroreflector is attached to the point of interest, and the laser reflects from it creating an interference pattern that's used for the measurement. Using an interferometer is the gold standard for high-accuracy position measurement, although commercial interferometers can be expensive and difficult to align.
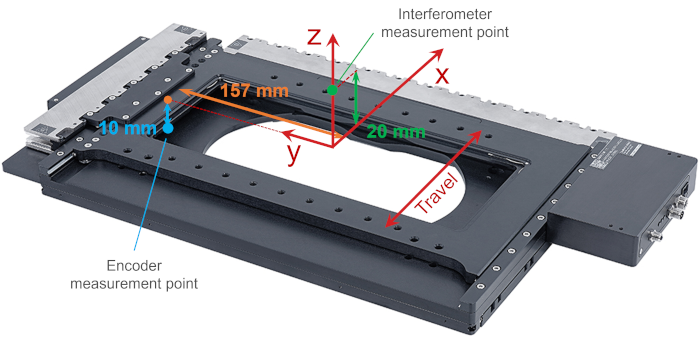
The results you can achieve from Zaber's built-in encoders give a remarkably comparable result in terms of velocity performance to a commercial interferometer. The main difference between encoder and interferometer data are due to the location at which they measure. As seen below on the ADR, Zaber locates the retroreflector for the interferometer measurement centered on the stage top, and 20 - 50 mm above it (depending on the stage in question), representing a region we expect customers will want to optimize accuracy at. The encoder measures the position at the encoder read head, which is typically 10 - 20 mm below the stage top and offset to the side by 0 - 150 mm (again depending on the stage). Zaber’s direct drive stages manage this through calibration, which effectively shift’s the encoder’s point of measurement to the same position above the stage top as the interferometer. This means that Abbe error is accounted for and is why the encoder measurements can be almost identical to those of the interferometer.
The other difference between the two sources of data is that the encoder has its own encoder grating error which shows up with a 5-10 kHz frequency at 100 mm/s. The interferometer does not capture this because these frequencies are effectively damped by stage inertia. The result of this is that filtering the encoder velocity data is recommended at sample frequencies over 1000 Hz to achieve a more physically relevant result.
Below we see an example of the consistency between encoder and interferometer results with an ADR, Zaber’s stage with the largest yaw lever arm.
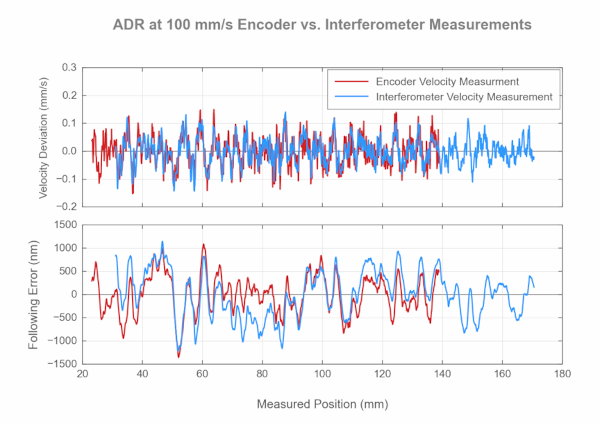
The discrepancies are small enough to be within the repeatability of the test moves.
Collecting Measurements with Zaber Launcher
To use Zaber Launcher to measure velocity performance, open the Oscilloscope application on the left-hand toolbar. With the axis you would like to capture information about selected, add the Velocity (encoder.vel) data source and Position Following Error (encoder.pos - pos) computed math channels to your scope as seen below. It can be helpful to hide the Trajectory Position and Position channels so they do not clutter the recording plot output.

It is worth noting that Velocity (encoder.vel) data has a 1.6 ms smoothing window applied to it while the computed Measured Velocity d(encoder.pos)/dt channel does not. This means Measured Velocity d(encoder.pos)/dt could capture more detail but is prone to high frequency encoder error when sampling higher than 1000 Hz.
Next, change the Capture Settings. Use the “Bufferend manual” capture mode with an appropriate sample rate (generally 1000 or 2000 Hz) and the desired movement length. At the bottom of the Capture Settings is the additional "Differencing Window" slider (not pictured) which can be used to filter the results if they contain too much high frequency noise. Ensure the maxspeed setting of the device is at the velocity you want to test and click start. The move and data transfer will take a few seconds.

From here you can zoom in on regions of interest in the move using the horizontal and vertical sliders or save the data to a .csv file using the menu in the top right corner for further analysis. Note that in contrast to the other plots in this article, the Oscilloscope app displays following error in the top plot and its axis label is on the right hand side. Additionally, the following error data is not automatically centered around zero because the Oscilloscope dataset will often include the acceleration or deceleration portion of the moves, not just the constant velocity portion.
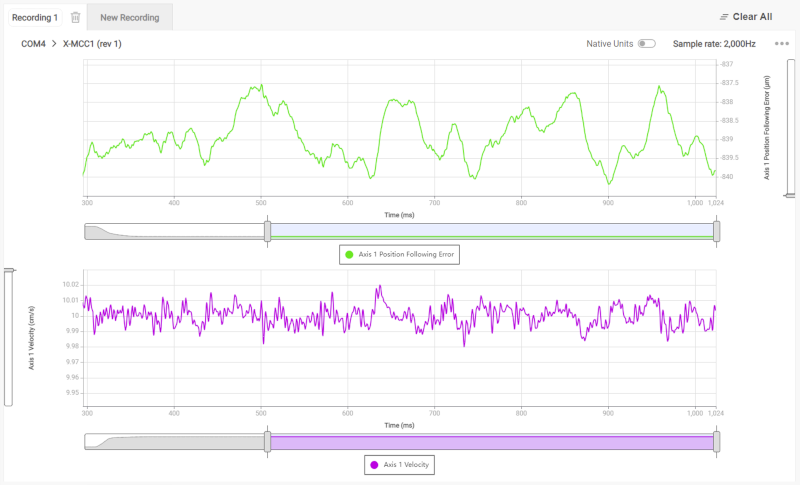
For more information, see the next article in this series which takes an in depth look at how to improve deposition consistency or etching toolpath errors by optimizing velocity performance on direct drive devices, what the error sources are, what frequencies errors appear at, and how performance is impacted by speed, payload, and servo tuning.
