Inexpensive Methods to Measure the Performance Characteristics of a Linear Motion Device
By Rob Steves, CEO
Published on Apr. 07, 2014
Abstract
Once you've determined the requirements of your linear motion application, how can you qualify a linear motion product to ensure it meets your application's needs? Manufacturer's specs are often vague and/ or incomplete. The only sure way is to test the product yourself. However, simply testing a product in the final application is usually not possible at such an early stage in the design process. This article will describe a series of tests that can be performed by the average user with little experience and without sophisticated measuring instruments to quickly determine the most important performance characteristics of linear motion systems.
Introduction
Any object in space has 6 degrees of freedom: linear motion along X, Y, and Z axes, and rotation about each of those axes. Consider a typical linear motion system, in this case a Zaber X-LSQ075D linear stage. With reference to Figure 1, let's define a coordinate system as follows:
- X – Horizontal axis parallel to axis of travel
- Y – Horizontal axis perpendicular to axis of travel
- Z – Vertical axis perpendicular to X and Y axes
- Roll – Rotation about X axis
- Pitch – Rotation about Y axis
- Yaw – Rotation about Z axis
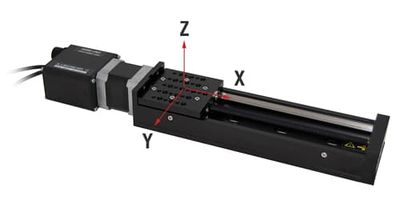 |
The goal of a single axis motion control device is to constrain 5 degrees of freedom while precisely controlling motion in the 6th. In the case of the pictured linear slide, all 3 rotational degrees of freedom are constrained, as well as 2 linear degrees of freedom. Motion in the X dimension is controlled.
Anyone who has purchased a linear motion product will recognize the most commonly quoted specifications:
- Range
- Speed
- Load capacity
- Position error (accuracy)
- Repeatability
- Backlash
- Resolution
I'll assume the reader is familiar with these so I will not define them here. Note that each of these specs describes behavior in the X dimension only. It may not be obvious, but it should be understood that a similar set of specs exists for each of the 6 degrees of freedom. It does not matter whether a degree of freedom is constrained. What can be measured in one degree of freedom can be measured in another.
In some cases, the values of the corresponding specs are obvious. For example, the "range", "speed", and "resolution" in any constrained dimension should be 0. In other cases, the spec may be familiar by another name. For example, "horizontal run-out" and "vertical run-out" are familiar specs which simply represent the position error in the Y and Z dimensions respectively.
Other specs are obscure enough that no standard naming convention has been adopted. For example, it's not uncommon to see values quoted for the position error in pitch, yaw, and roll dimensions, but each manufacturer seems to call them something different. Still other specs are rarely quoted at all. You are unlikely to see repeatability or backlash quoted for anything but the axis of travel, though these specs certainly do exist in the other degrees of freedom. While certain specs are rarely quoted, their values are often required by the user. Sometimes the only way to obtain these specs is to test the device oneself. It is that process with which the remainder of this article is concerned.
Test Equipment
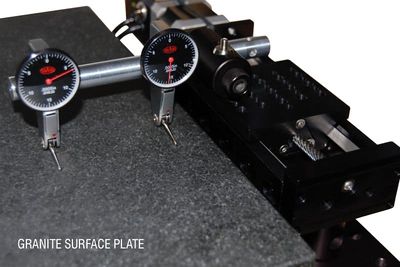
The test subject and some typical test equipment are shown in Figure 2.
In the top left is an optical bread board (an anodized aluminum plate with tapped holes at regular intervals). In the top right is a granite surface plate. Surprising accuracy in a surface plate can be had at very little expense these days. About $40 will buy you a 12"x12" surface plate certified flat to within 0.0001". At the bottom of the photo are two dial indicators with divisions of 0.0005" and some hardware for mounting them in various configurations. You will see other equipment used in the remaining photos, but it is all variations on the same theme.
 |
Measuring Speed
Typically the only axis of interest with regard to speed is the X axis (the axis of travel). There is invariably some motion in the other degrees of freedom, which we will measure shortly, but usually only the position error and not the speed is of concern. Along the axis of travel, there are several speed related specs the user may be interested in. These are the minimum speed, the speed resolution, the speed error (accuracy) and the maximum speed. Only specific, discrete speeds can be achieved by a digital control system. The minimum speed is typically the same as the speed resolution and these are usually predefined by the control hardware and can be determined simply by referring to the "set speed" instruction or the equivalent that should exist for any motion system.
The speed error can be determined relatively easily with an ordinary stopwatch. Simply set the acceleration to 0, set the speed to a low value, and execute a move instruction calculated to take exactly 1000 seconds to complete. Using a stopwatch, even accounting for human error it's easy to achieve +/- 1 second timing accuracy, so for a 1000 second move you should be able to measure the speed to an accuracy of +/- 0.1%.
If you require more accuracy you can try executing a move that takes 10000 seconds to complete, thereby achieving +/- 0.01% accuracy in measurement of the speed. If you have all day (literally) you can try 100000 seconds to obtain +/- 0.001% accuracy. This assumes you have a stopwatch that is accurate to better than 1 second per day. If the motion device is computer controlled, as our test subject happens to be, measuring the speed is much easier.
A test script can be written to execute a move, measure how much time it takes to complete, and calculate and display the actual speed and the speed error. Note, however, that operating systems are non-deterministic and may not be able to measure completion time any more accurately than a person with a stopwatch, depending what processes are running on the machine. The maximum speed can be determined by trial and error, but note that it will likely be dependent on the load.
Measuring Load Capacity
The load applied to a linear motion device can be in the form of forces along X, Y, and Z axes, or moments about those axes. For example, a centered weight mounted to the stage applies a force only in the Z dimension. If the weight is not centered it applies both a force in the Z dimension and a moment about the X or Y axis (or both). These forces and moments will affect both the lifetime of the device as well as its ability to move at all. There are two load specs commonly quoted. These are the maximum load, above which the slide will stall, and the recommended load, above which the lifetime of the slide may be reduced below the warranty period. Often only the recommended load is quoted since manufacturers are not keen on encouraging users to push their devices to an early demise. However, users should be aware that the recommended load can often be exceeded by a significant margin if the corresponding reduction in lifetime is tolerable.
The maximum load is usually dependent on the speed. To measure it, a known force or moment (or a combination of a force and a moment since it is difficult to separate the two) can be applied by attaching fixed weights to the stage. Then the speed can be varied to determine the maximum achievable value. Testing a few different weights and interpolating will yield a reasonable plot of the maximum load as it varies with speed.
Determining the effect of load on lifetime is not nearly as easy as determining the effect of load on speed. It requires that several devices be cycle tested till failure at different loads, which is usually not practical for the end user. For the manufacturer, however, it is often the case that individual components such as bearings and rails can simply be replaced for successive tests, reducing the cost of lifetime testing significantly.
Measuring Position Error
As mentioned above, position error is generally the spec of primary concern to the user. Position errors can be measured in each of the 6 degrees of freedom. Often a single set-up can be used to measure a position error in both a linear and a rotary dimension simultaneously.
Measuring Y Error and Yaw Error
The set-up for measuring the yaw error also serves to measure the Y error. See Figure 3. The granite surface plate is mounted parallel to the linear slide. The two dial indicators are mounted to the stage in such a way that their contact probes gently touch the vertical side of the granite surface plate. The surface plate is aligned parallel to the slide in such a way to minimize the change in dial gauge readings over the range of travel of the slide.
In order to measure only yaw with no component of roll, it is important that the contact points of the probes with the surface plate lie in the same plane as the slide's bearings. Observing the set-up, one can see that small motions in Z and X directions will have no effect on the dial readings. Nor will small changes in pitch or roll angle. Thus it is clear that this is a good set-up for measuring Y and yaw position errors.
 |
At several locations throughout the travel of the slide, readings can be taken from both dial gauges. At each location, the Y position can be calculated as the average of the two dial readings, while the yaw angle (in radians) is the difference between the two readings divided by the distance between the probes (5" in our case). The maximum variation in Y position and yaw angle over the full range of travel gives the Y error and yaw error respectively. The Y error is more commonly referred to as the horizontal run-out.
Measuring Pitch Error
Pitch error, in this context, should not be confused with lead screw pitch error. Lead screw pitch error manifests itself as a contribution to the X Error which will be measured later. The pitch error, in the current context refers to the variation in pitch angle of the slide platform as it travels over it's full range of motion in the X dimension.
The set-up for measuring the pitch error is shown in Figure 4.
It is similar to that for measuring the yaw error, but the probes of the dial gauges are run against the horizontal edge of the granite surface plate rather than the vertical edge. Again it is important that the points of contact with the surface plate lie in the same plane as the linear slide bearings. The slide has been raised off the optical breadboard on pillars to achieve this. One can see that small motions in X or Y will have no effect on the dial readings. Nor will small changes in yaw angle. Changes in Z position and roll angle will affect the readings of the gauges but both gauges will be affected equally. Since the pitch angle is related to the difference between the two readings, its measurement will not be adversely affected by the Z error or roll error.
 |
The pitch angle (in radians) is given by the difference between the two readings divided by the distance between the probe contact points (5" again). The variation in measured pitch angle over the full travel gives the pitch error. One might be tempted to use this set-up to measure the Z error as well, but that would be a poor choice since it would be impossible to distinguish the Z error from the component of roll error that would also be measured.
Measuring Z Error and Roll Error
The set-up for measuring the roll error is shown in Figure 5.
The linear slide and granite surface plate are kept in the same positions as for pitch measurement, but the dial gauge set-up is turned so that the points of contact lie along the Y axis. One can see that small motions in X and Y will have no effect on the dial readings. Nor will small changes in pitch or yaw angle. Therefore this is a good set-up for measuring Z error and roll error provided there is a way to distinguish between the two. The dial gauges are set up such that the points of contact are 2.5" apart and the contact point of the rightmost probe is 2.5" from the center of the stage. It may not be immediately obvious, but a little geometry will show that the Z position is given by doubling the rightmost reading and subtracting the leftmost reading.
 |
The roll angle is given by the difference between the two readings divided by the distance between the probes (2.5" in this case). The variation in Z position and roll angle over the full range of travel gives the Z error and roll error respectively. Z error is more commonly referred to as vertical run-out. There are simpler methods of measuring the Z error if that is your only interest, but if you are measuring position errors in all degrees of freedom, measuring Z error and roll error with the same set-up is convenient.
Measuring X Error
The position error along the X axis is often referred to as "accuracy" but that is a misnomer since a larger value indicates a less accurate device.
This spec is almost always quoted by the manufacturer so it is usually not necessary for the user to test it. This is lucky since it is the most difficult spec to measure without expensive equipment.
Figure 6 shows a typical set-up for measuring the X error. A linear encoder is mounted and precisely aligned parallel to the X axis. The resolution of the encoder must be smaller than that of the motion control device you wish to test. In this case a Heidenhain MT 1271 length gauge is being used. It has a resolution of 0.05 um. The linear slide in question has a relatively coarse lead screw and therefore its resolution is only 1 um. It is nice if the range of motion of the gauge is greater than that of the motion device being tested but this isn't strictly necessary as it's possible to get a good idea of the position error over a relatively short distance. The gauge in the photo has a travel of only 12 mm while the linear slide has a range of 75 mm.
 |
The keen observer will note that as set up in the photo, the gauge will be measuring a small component of pitch and yaw error in addition to the X error. However, given the short range over which the X error is being measured, it is unlikely that the pitch and yaw angles will change significantly. Especially in stepper motor controlled systems which are open loop, most of the position error along the axis of travel can be traced back to the motor itself. If your device uses a micro-stepping controller you should be sure to look at positioning errors under three different scenarios:
- Moving in single microsteps over at least 4 full steps.
- Moving in full steps over at least one full revolution of the motor.
- Moving in full revolutions over the range of the device (or your gauge).
In motion systems based on bipolar stepper motors, there will be cyclic errors that repeat with periods of 1 step, 4 steps, and 1 full revolution. In addition there will also be error associated with the leadscrew. The total position error at any given location within the range of travel is the sum of all these error components. Usually only the total error is quoted, but it is useful to have an idea of the amount of error contributed by each source since some errors can be eliminated, for example by moving in full steps, or full revolutions of the motor.
Understanding the contribution from each source of error allows one to reasonably estimate the degree to which moving in full steps, or full revolutions may improve performance.
Measuring Repeatability
Repeatability specs, if quoted at all, are usually quoted only for the axis of travel. But any degree of freedom that has a position error also has a repeatability. By performing the position error measurement tests above multiple times for the same set-up, the repeatability of the X, Y, Z, yaw, pitch, and roll errors can be determined. Depending on the application, it may not be important that a linear motion system be very accurate. Sometimes it need only be very repeatable. Typically, the repeatability of linear motion systems (especially stepper motor based ones) is significantly better than their accuracy.
Measuring Backlash
Like repeatability, backlash is usually quoted only for the axis of travel, but any degree of freedom that has a position error can also have a backlash. In other words, approaching a location from one direction may result in a different error measurement than approaching the same location from the other direction. The difference between the two error measurements is the backlash which is usually relatively constant over the full range of travel.
Backlash may also be referred to as bidirectional repeatability and can be measured as one might expect, simply by approaching locations from either direction and comparing the results.
Measuring Parallelism
All of the specs mentioned so far are dynamic specs. That is, they are related to the motion of the device rather than to its static geometry. A device must be moved in order to measure a dynamic spec. Parallelism is one of the few static specs a user may be interested in measuring. While the pitch, yaw and roll errors are measures of the change in angular position as the slide moves through its range of travel, parallelism is a measure of the baseline from which those changes occur.
Figure 7 shows a typical set-up for measuring parallelism. A height gauge mounted to a granite surface plate is used to measure the height of the stage surface at various locations. The parallelism is simply the variation in height.
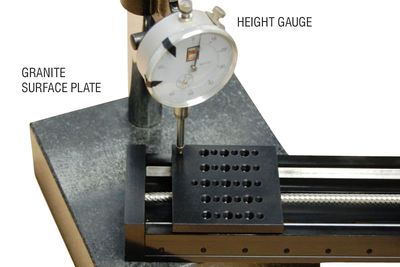 |
If desired, one can be more specific and quote parallelism in the X dimension (the variation in height from front to back) and parallelism in the Y dimension (the variation in height from side to side) as separate entities, but typically only a single value is quoted. Parallelism can be converted to an angle in radians simply by dividing by the appropriate dimension (length or width) of the stage surface.
Conclusion
Using relatively inexpensive equipment, it is possible to measure several important performance characteristics of a linear motion device. These measurement techniques are useful both for verifying specs quoted by the manufacturer and for determining specs that have not been quoted.